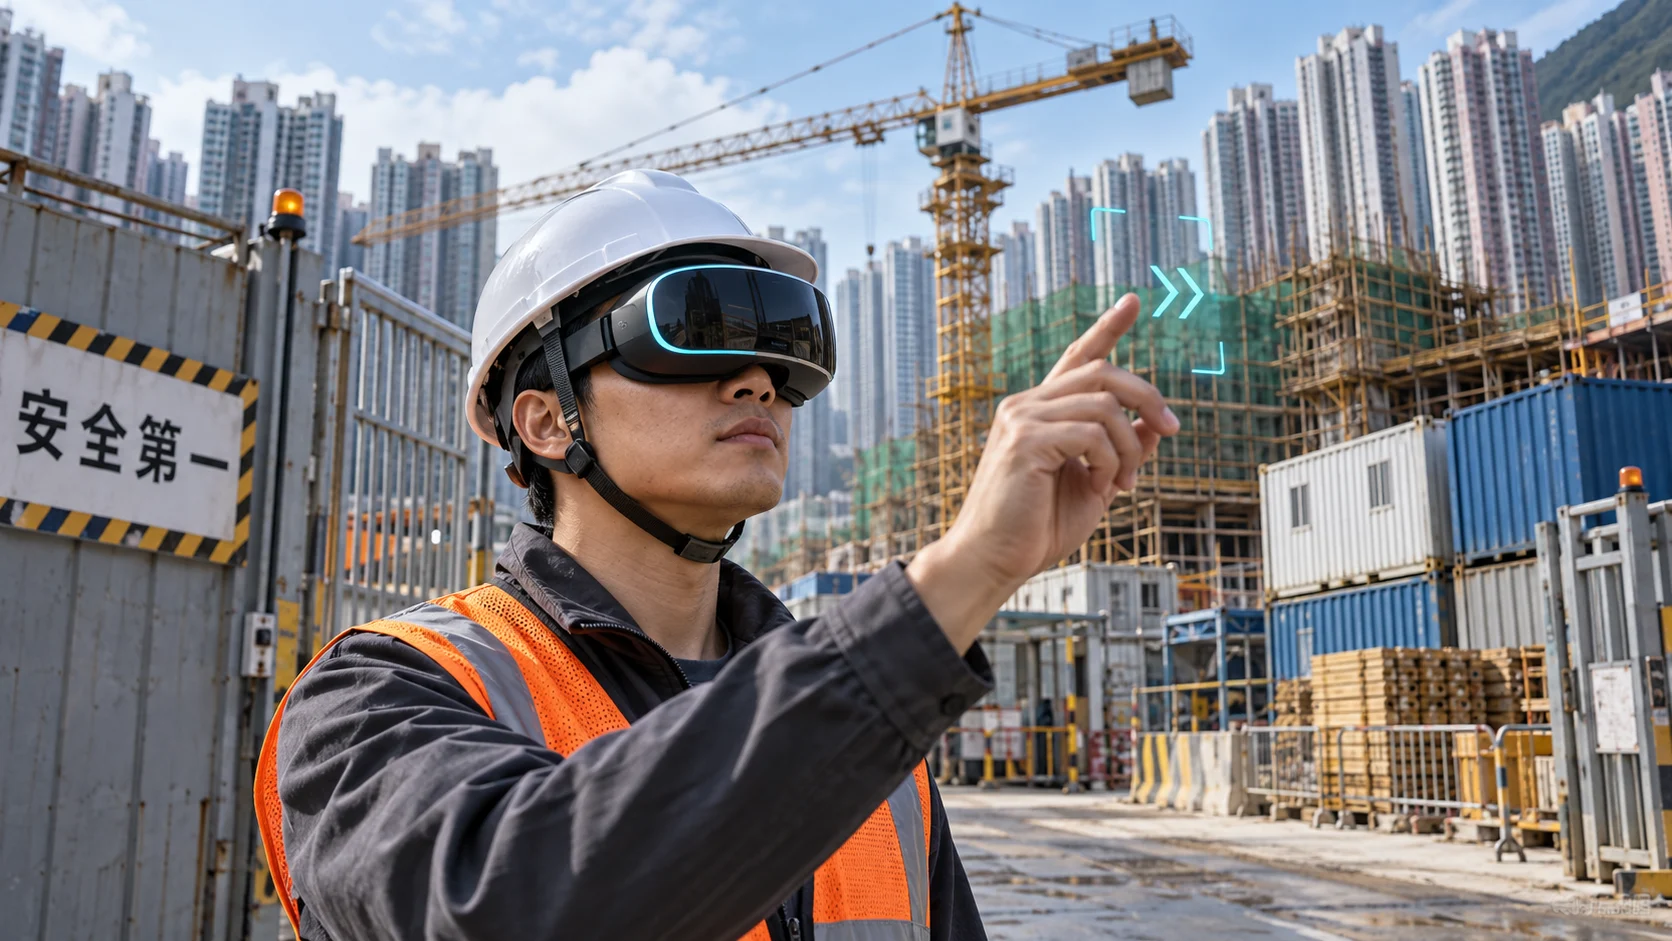
Does VR Construction Safety Training Reduce Accident Rates? A Complete Data Guide to CTP’s 83% Figure
Yes, VTM CTP’s deployment records include quantifiable outcome figures — but to interpret them accurately, you need to understand their measurement methodology, sample scope, and comparison baseline. This article takes VR construction safety training’s headline statistic — VTM CTP’s 83% accident rate reduction — as its starting point, placing it side by side with Build King’s 25% efficiency improvement and the Hong Kong Labour Department’s official construction industry accident statistics. Every figure comes with the context it deserves: nothing hidden, nothing overstated.
HK Construction Industry Accident Rate: What Is the Official Baseline?
Before interpreting any VR training outcome figure, you need the industry-wide trend as a reference baseline.
The Labour Department (labour.gov.hk) publishes annual Occupational Safety and Health Statistics, which include reported accident figures and trend analysis for the construction sector. This government report covers the entire Hong Kong construction industry and is the only externally independent measure of the sector baseline:
- Construction has consistently been one of Hong Kong’s highest-risk industries for occupational injuries
- Reported accident figures fluctuate year to year, influenced by construction volume, seasonal factors, and enforcement intensity
- Industry accident rate is typically expressed as “accidents per 1,000 employed workers” to enable year-on-year comparison
The measurement logic behind this government figure — “all Hong Kong construction workers, measured by the government” — and that behind the VTM CTP figure below — “CTP-deployed projects, vendor records” — operate at entirely different measurement levels. The two cannot simply be subtracted from each other, but placing them side by side helps you assess where a VR training figure sits in the broader industry context.
Data Comparison Table: Three Figures, Three Measurement Levels
| Data Point | Figure | Source | Measurement Period | Sample Scope | Comparison Baseline | Known Limitations | Evidence Tier |
|---|---|---|---|---|---|---|---|
| HK Construction Industry Overall Accident Rate | See Labour Department annual report (updated annually) | Labour Department labour.gov.hk | Annual | All HK construction workers | Year-on-year trend | Affected by construction volume and reporting rates; does not distinguish training interventions | Independent (government official statistics) |
| VTM CTP: 83% Accident Rate Reduction | 83% | VTM deployment project records | During CTP-deployed project construction period | Aggregate of CTP-deployed projects (not industry-wide) | Concurrent comparable projects or pre-deployment baseline | Non-RCT; variable project scale; internal records, no external audit | Vendor self-report |
| Build King: 25% Efficiency Improvement | 25% | Build King case study (client self-reported) | During Build King’s related project period | Single client (Build King) specific project | Build King’s own baseline | Client self-reported, not independently verified; “efficiency” definition per client’s internal standards | Client self-report |
VTM CTP’s 83% Accident Rate Reduction: Methodology Note
| Measurement Period | Project construction record period for CTP-deployed sites (no fixed date range; spans multiple deployments) |
|---|---|
| Sample Scope | Aggregate of CTP-deployed projects — represents “sites that used CTP,” not the Hong Kong construction industry as a whole, and does not include sites where CTP was not deployed |
| Measurement Method | Before-and-after comparison of reported accident counts (within-subject before-after comparison) |
| Comparison Baseline | Accident rate of concurrent comparable projects, or the historical baseline of the same site before CTP was introduced |
| Known Limitations | Non-randomised controlled trial (non-RCT); variable project scale and construction type; based on internal records without independent external audit; may be affected by confounding factors such as overall site management improvements |
| How to Read This Figure | This figure reflects “the observed change in accident rate at sites where CTP was actually deployed.” It is an appropriate reference for procurement decisions, but should not be interpreted as “VR training will necessarily deliver an 83% accident rate improvement at any worksite.” |
Build King’s 25% Efficiency Improvement: Methodology Note
| Source | Build King client case study — client self-reported figure |
|---|---|
| Measurement Period | During Build King’s relevant construction project(s) |
| Sample Scope | Specific project(s) from a single client (Build King), not aggregated multi-client data |
| Metric | Construction efficiency improvement (note: “efficiency” ≠ “accident rate” — these measure different dimensions and should not be combined or directly compared) |
| Known Limitations | Client self-reported; no independent third-party verification; the specific definition and measurement method for “efficiency improvement” is based on Build King’s internal standards |
| How to Read This Figure | This figure reflects Build King’s self-assessment on specific projects. It is useful as a same-industry case reference, but should not be extrapolated as an industry-wide efficiency improvement benchmark. |
“Non-Randomised Controlled Trial” Is a Real-World Constraint, Not a Reason to Doubt the Number
When readers see the words “non-RCT,” some instinctively conclude “the figure can’t be trusted” — this misunderstanding is worth addressing directly.
In a construction environment, randomised controlled trials (RCTs) are practically impossible to conduct: randomly assigning workers to “trained” and “untrained” groups would violate employers’ legal occupational health and safety obligations, and would be ethically unacceptable. As a result, nearly all construction training outcome research in practice uses “before-and-after comparison” or “case study” designs — this is a real-world constraint of the research environment, not a vendor’s evasion, and it does not mean the figures are fabricated.
The correct way to read these figures: treat them as “observed changes under specific deployment conditions,” while being clear about their boundaries — which sites, which time period, which measurement method. A figure with well-defined boundaries is more practically useful for procurement decisions than a “rounded-off number with no boundary conditions.”
VTM CTP’s PA24-072 record is archived by the Construction Industry Council’s CITF and is currently the only publicly verifiable third-party asset — accessible directly at citf.cic.hk.
How to Correctly Compare Outcome Figures Across VR Training Solutions
Before comparing outcome figures from different vendors, first check each figure’s “evidence tier” — measurement method, sample scope, and whether independent verification exists. The table below ranks the four data sources cited in this article by tier so you can evaluate them against a single standard:
| Source | Tier | Notes |
|---|---|---|
| Labour Department labour.gov.hk official accident statistics | Independent (government official statistics) | HK construction industry baseline, externally independently measured, updated annually |
| CIC CITF PA24-072 | Third-party institution | CTP approval record archived by the Construction Industry Council, publicly accessible |
| VTM deployment project records (83% accident rate reduction) | Vendor self-report | Internal records with methodology disclosure; no independent external audit |
| Build King case study (25% efficiency improvement) | Client self-report | Single client self-reported; no independent verification |
Further Reading: VR Hazard Scenario Simulation in Practice: Hong Kong Construction Site Safety Training 2026
Frequently Asked Questions (FAQ)
Understand the Real Outcomes of VTM CTP’s Construction Safety Training Platform
VTM Digital is a Hong Kong government-recognised (PA24-072) VR construction safety training provider serving 80+ government and public-sector projects. We offer full methodology transparency — you can ask us how any figure was measured.
References
- Labour Department Occupational Safety and Health Statistics — Hong Kong construction industry accident rate official baseline, updated annually
- CIC CITF PA24-072 Approval Record — CTP third-party institutional approval asset, publicly accessible